
Introduction
Hello and welcome back! Today we are going to talk about debugging stripped binaries. Additionally, I'm going to show you how we can bypass ptrace with a debugger. To demonstrate this, we are going to use the secret flag binary from an earlier challenge. This binary was stripped of it's symbols and also uses ptrace as a means to stop us from debugging the program. In this blog post, I'll show you how we can find the main function in gdb and bypass this anti-debugging measure.
Finding Main
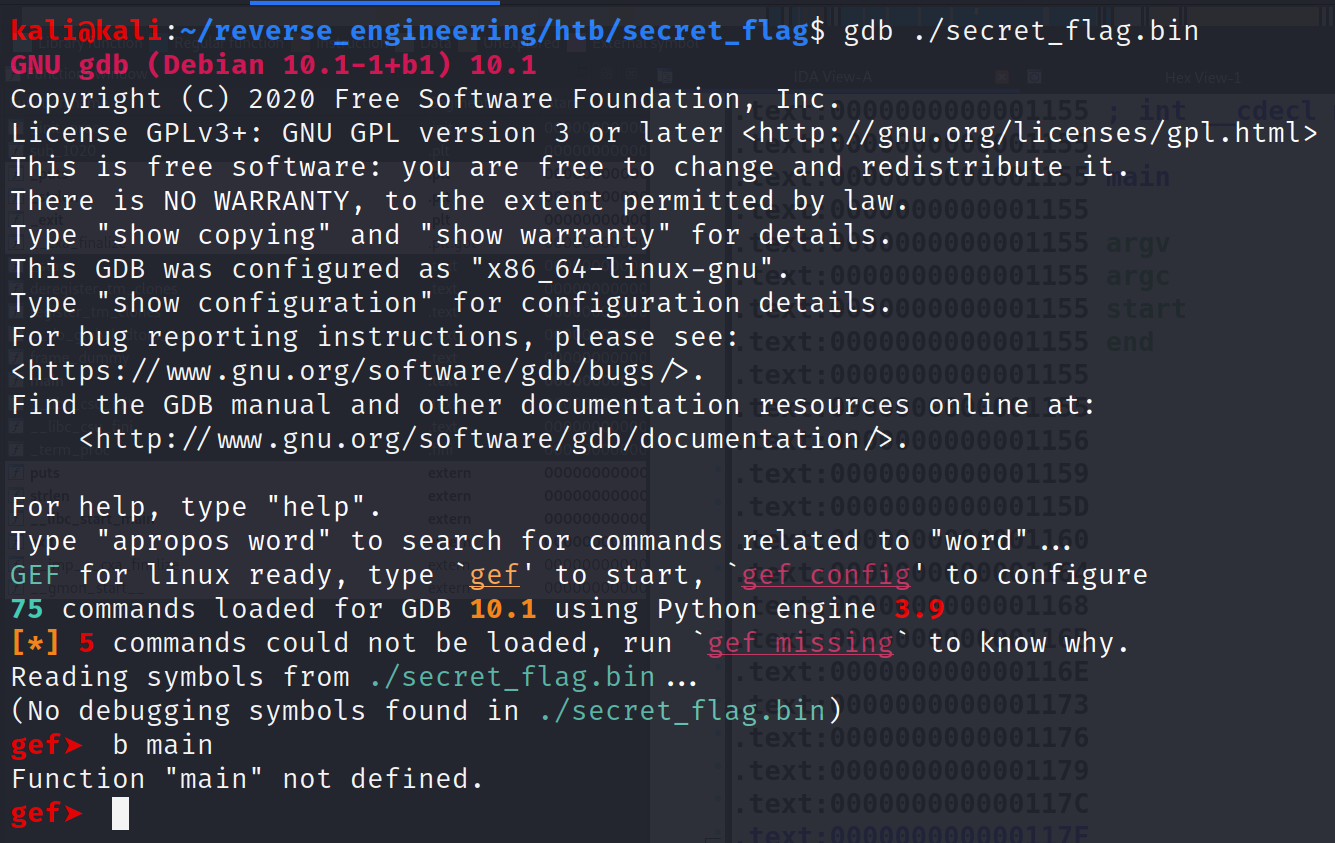
The first thing we need to do is find the main function. If we try to set a breakpoint at main when we initially load the binary we'll get an error.
This is obvious because the main function and other function names have been stripped from the binary. What we need to do first is find the entry point. This can be done by running info file. This will print all the symbols in the binary as well as the entry point. The entry point isn't main necessarily. This is just where code begins which isn't actually main. The main function is actually called as an argument to another function! But, we won't talk about that today. Let's move on.
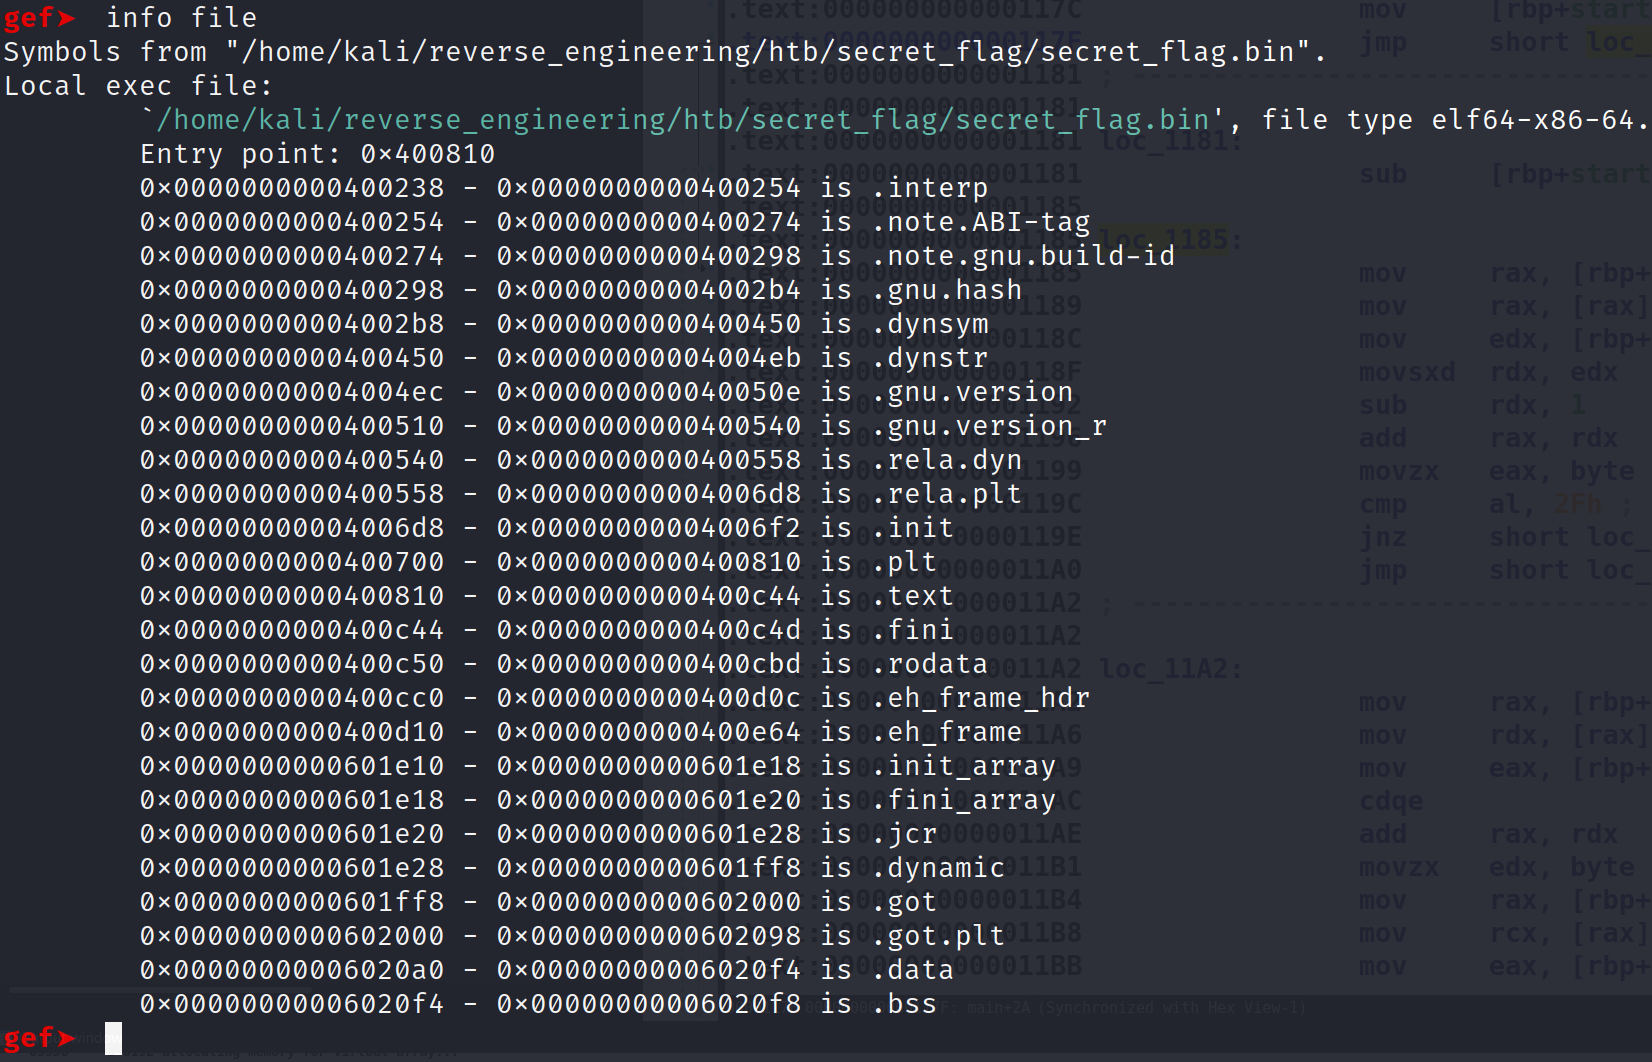
GDB tells us the entry point for this binary is 0x400810. Let's examine 15 instructions from this address. That is x/15i 0x400810.
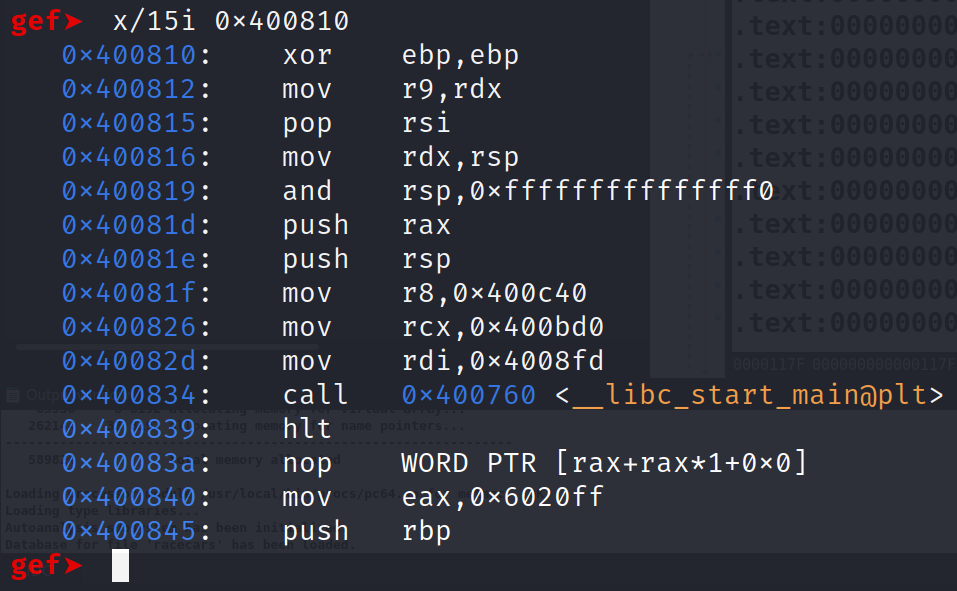
This isn't exactly a function prolog that we are used to seeing. But, we do see a function being called, __libc_start_main@plt. This function performs all of the necessary initialization for the main function. To put it simply, this calls the main function. In fact the address of the main function is it's first parameter. We know from experience that the first parameter in a 64-bit binary is stored in the RDI register. Well, we see another address being MOV'd into the RDI register. This is the address of the main function! We've successfully found the main function! If this were a 32-bit program, we'd see PUSH instructions before __libc_start_main@plt was called. Recall on 32-bit programs, arguments are passed on the stack. Now that we are armed with the address of main, let's set a breakpoint there and run the program!
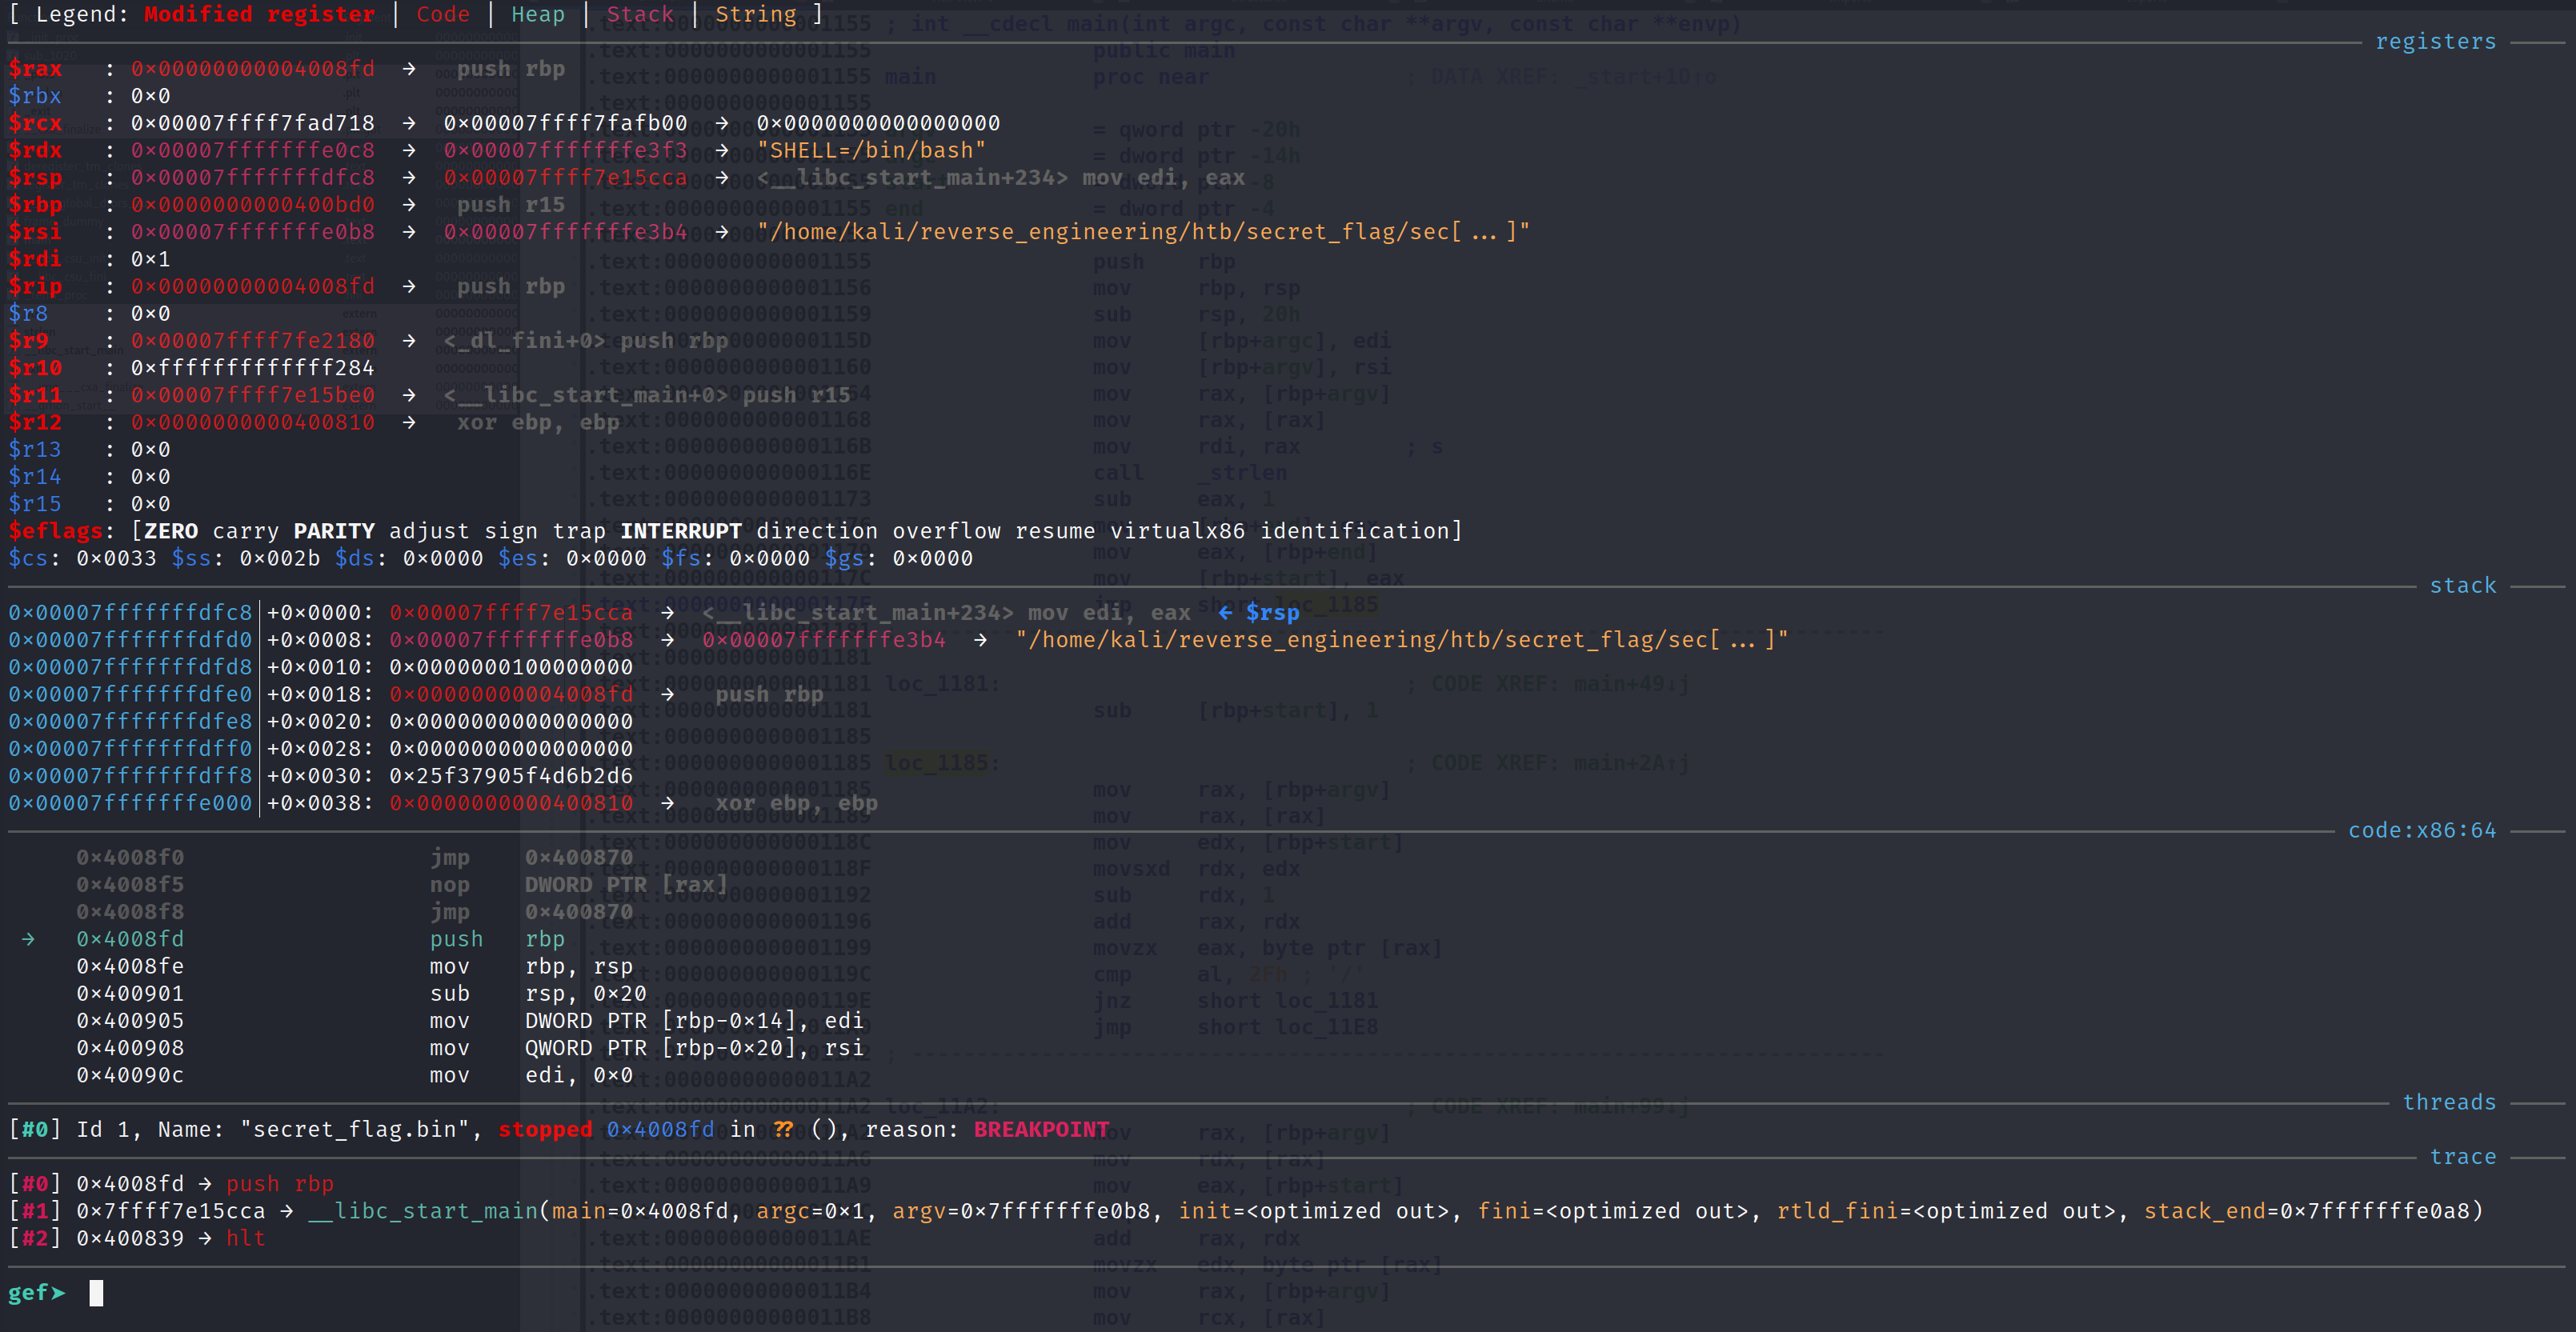
Alright we did it! We are at the main function. To confirm, you can open this in IDA, navigate to this address and you'll notice the instructions are the same! We can see the code in the code section of this image but let's examine, say, 50 instructions from the main function.
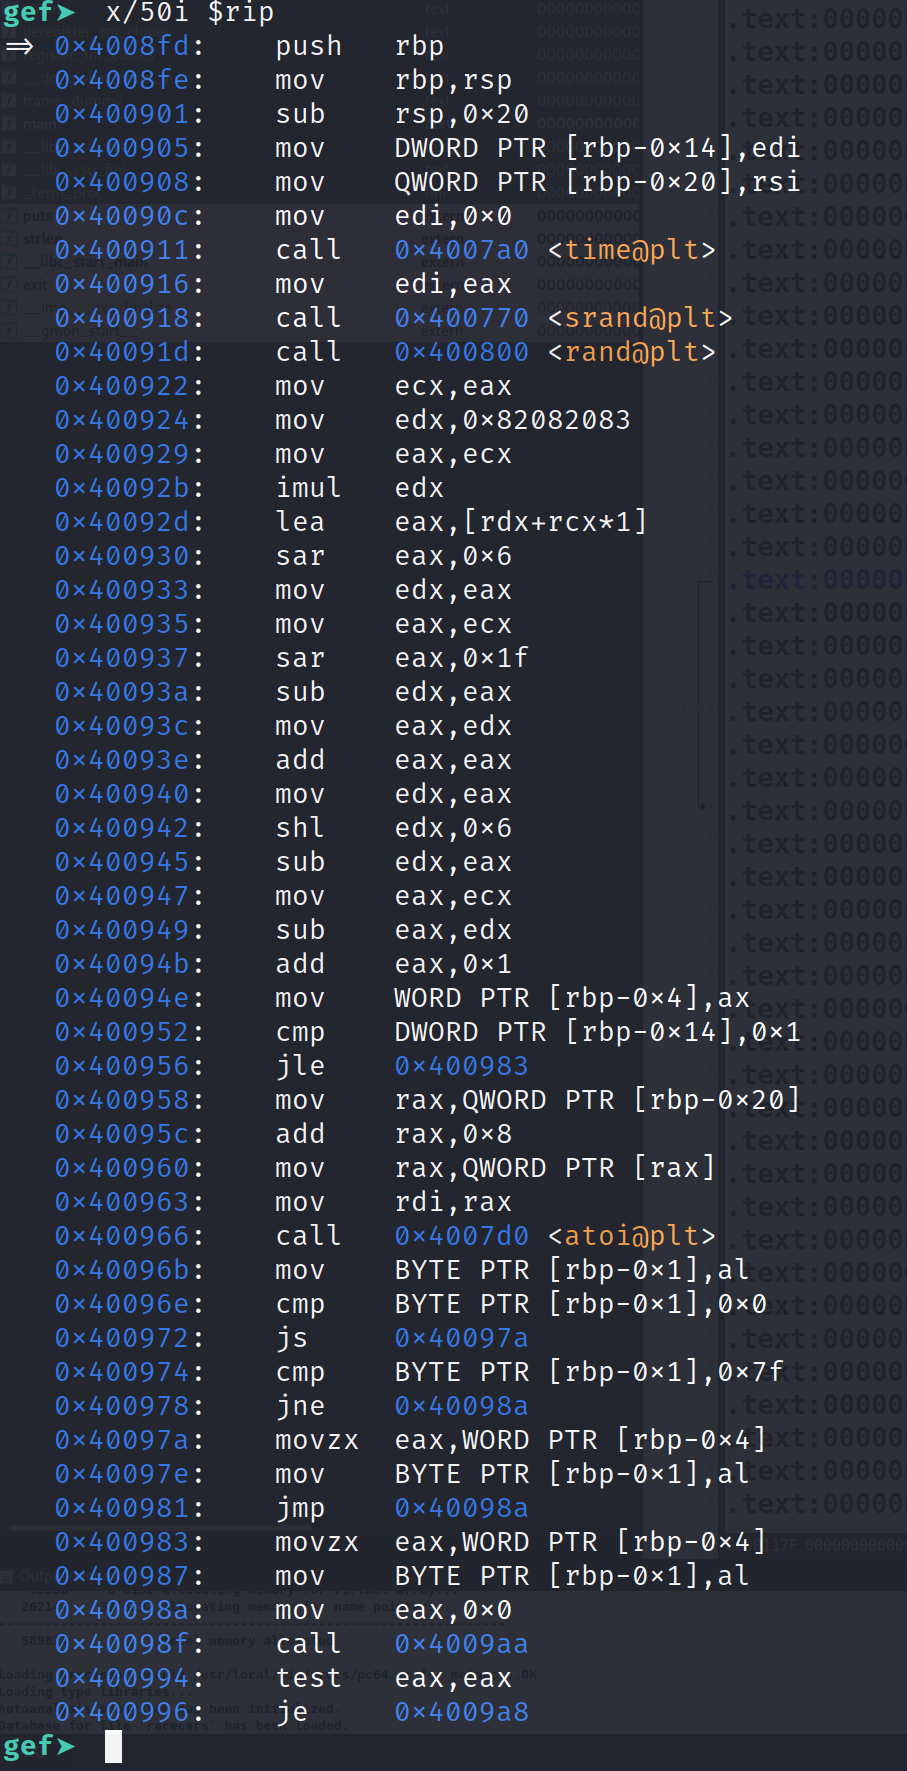
Alright great! If you read the blog for the secret flag challenge or watched the YouTube video, the disassembly should be very familiar. We can step through this program without an issue.
Bypassing ptrace
Now, we know eventually this program will call ptrace, which will inhibit us from debugging any further. Let's set a breakpoint when ptrace is called. Simply type, b ptrace and type continue or the shortcut c.
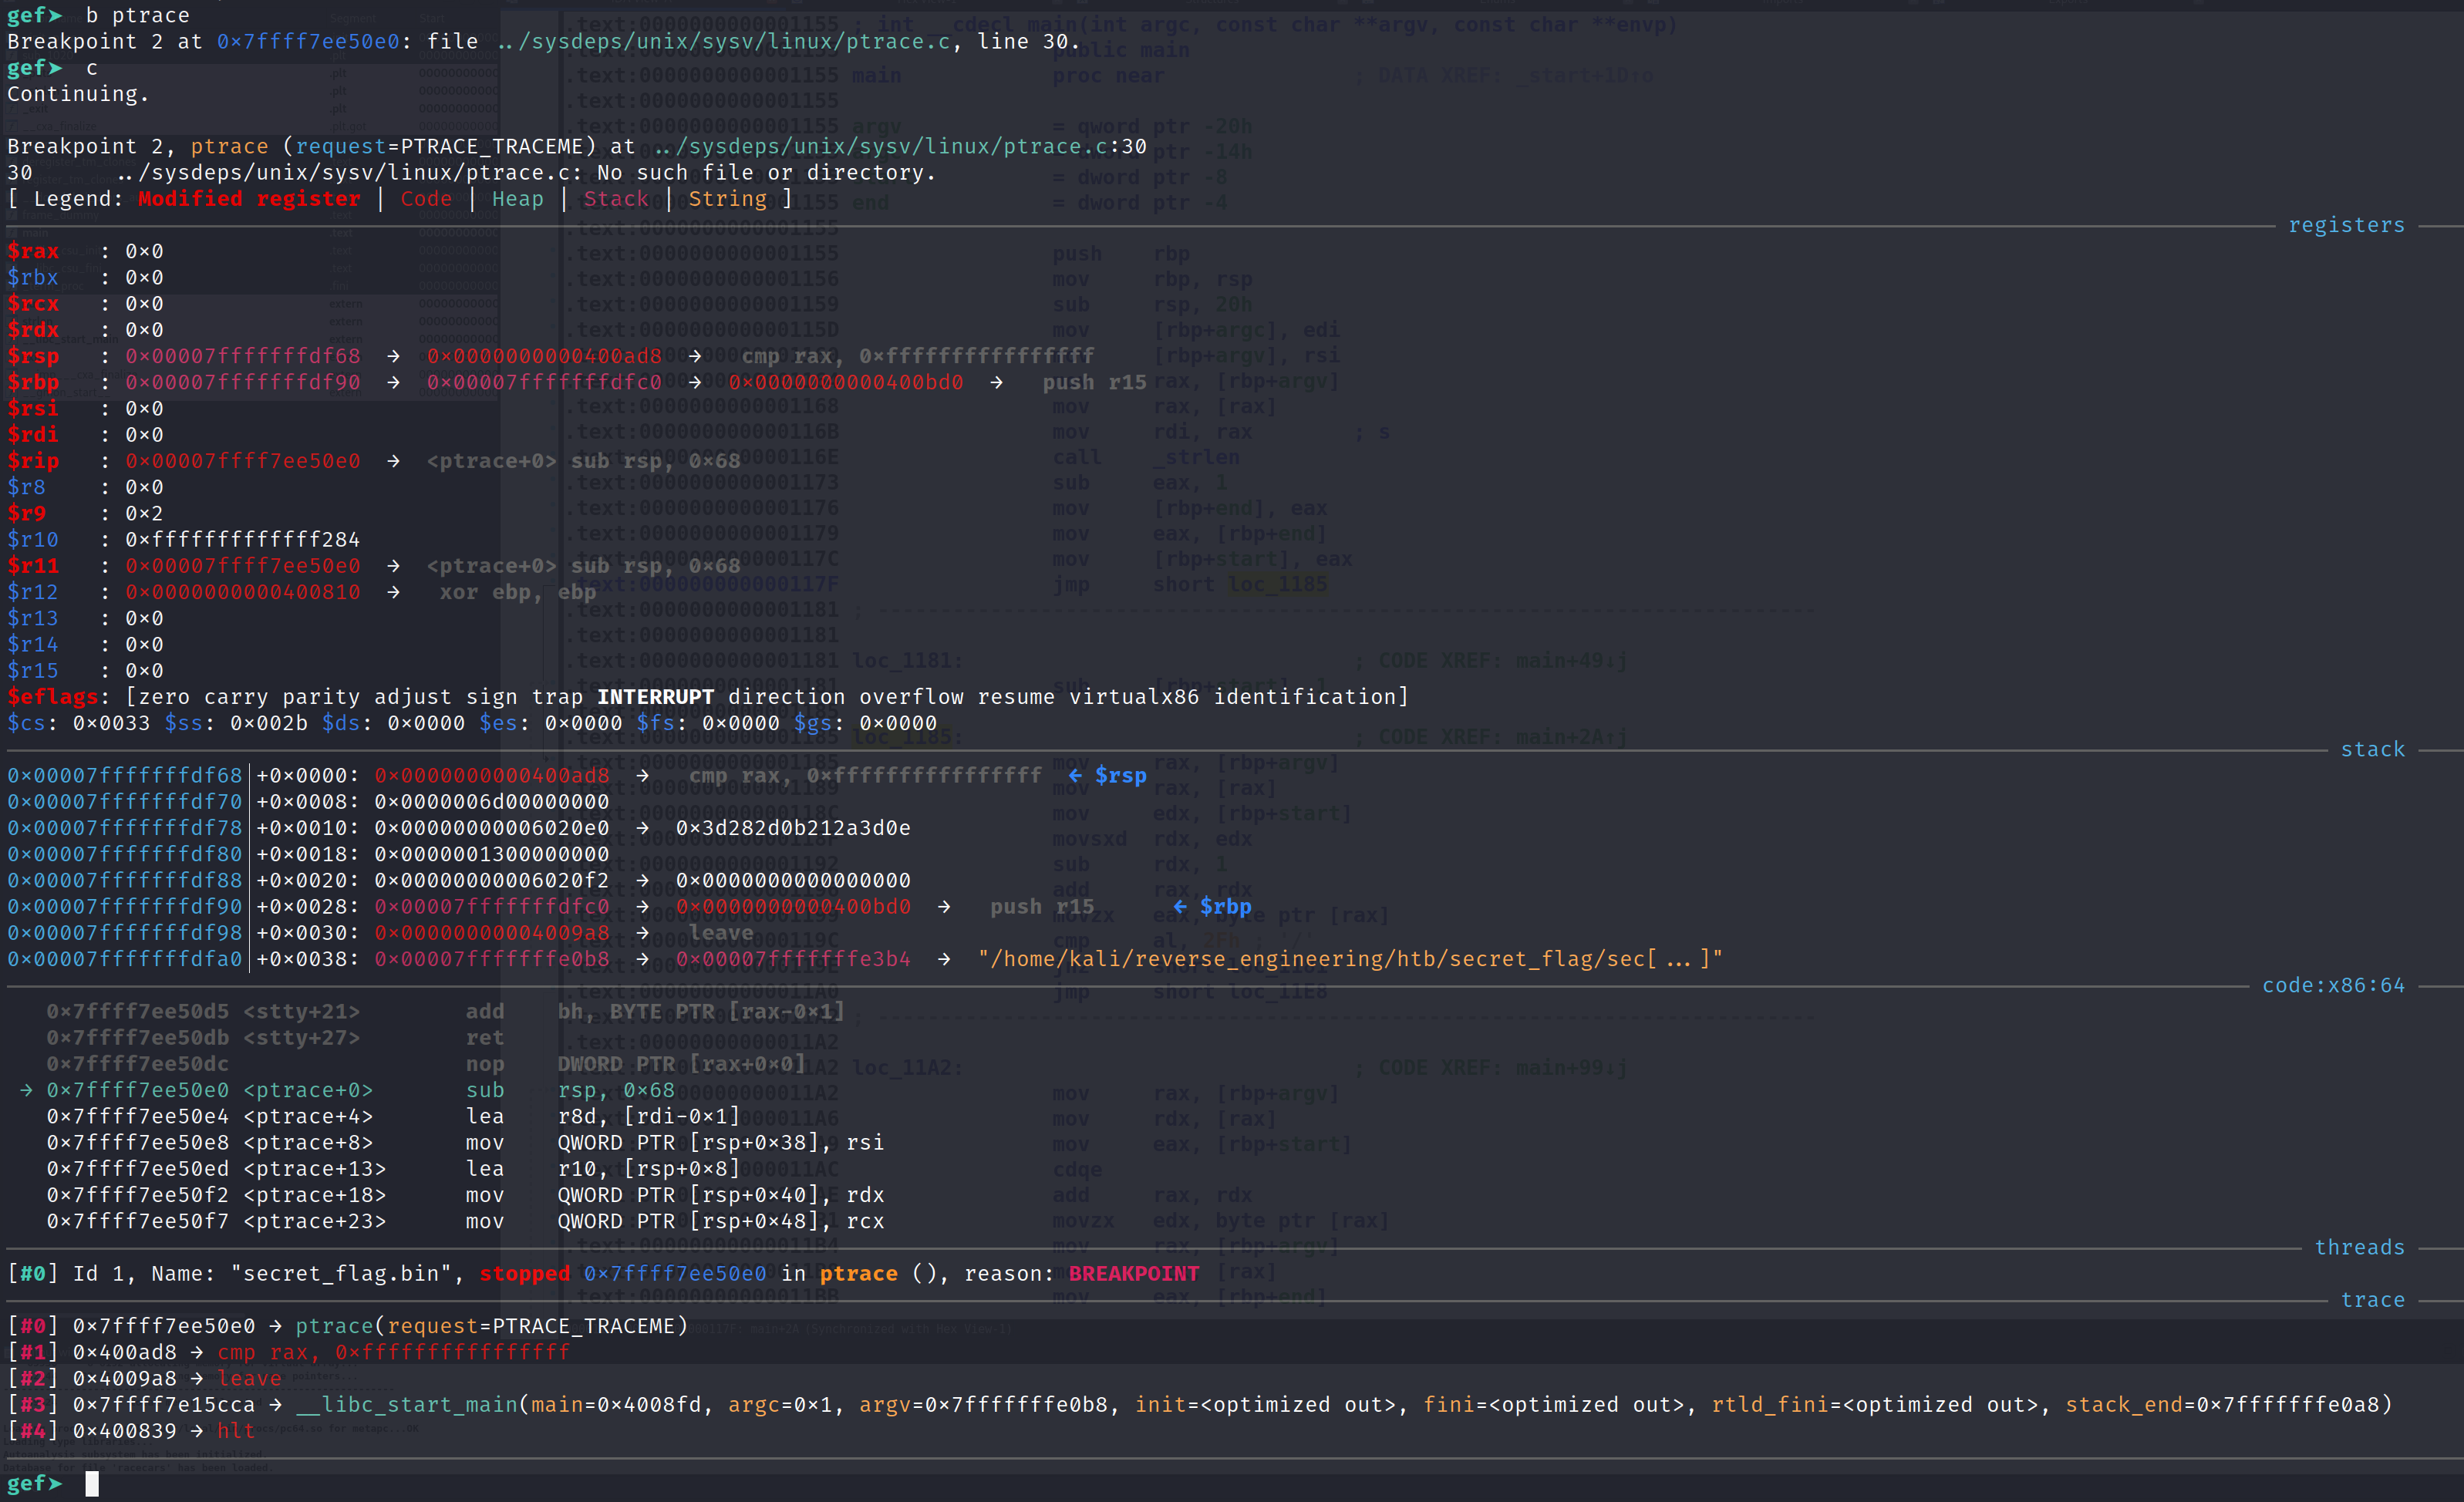
We successfully set a breakpoint and we are now inside the ptrace function. We can step through this function but it won't do us much good. Let's allow the function to finish by typing finish.
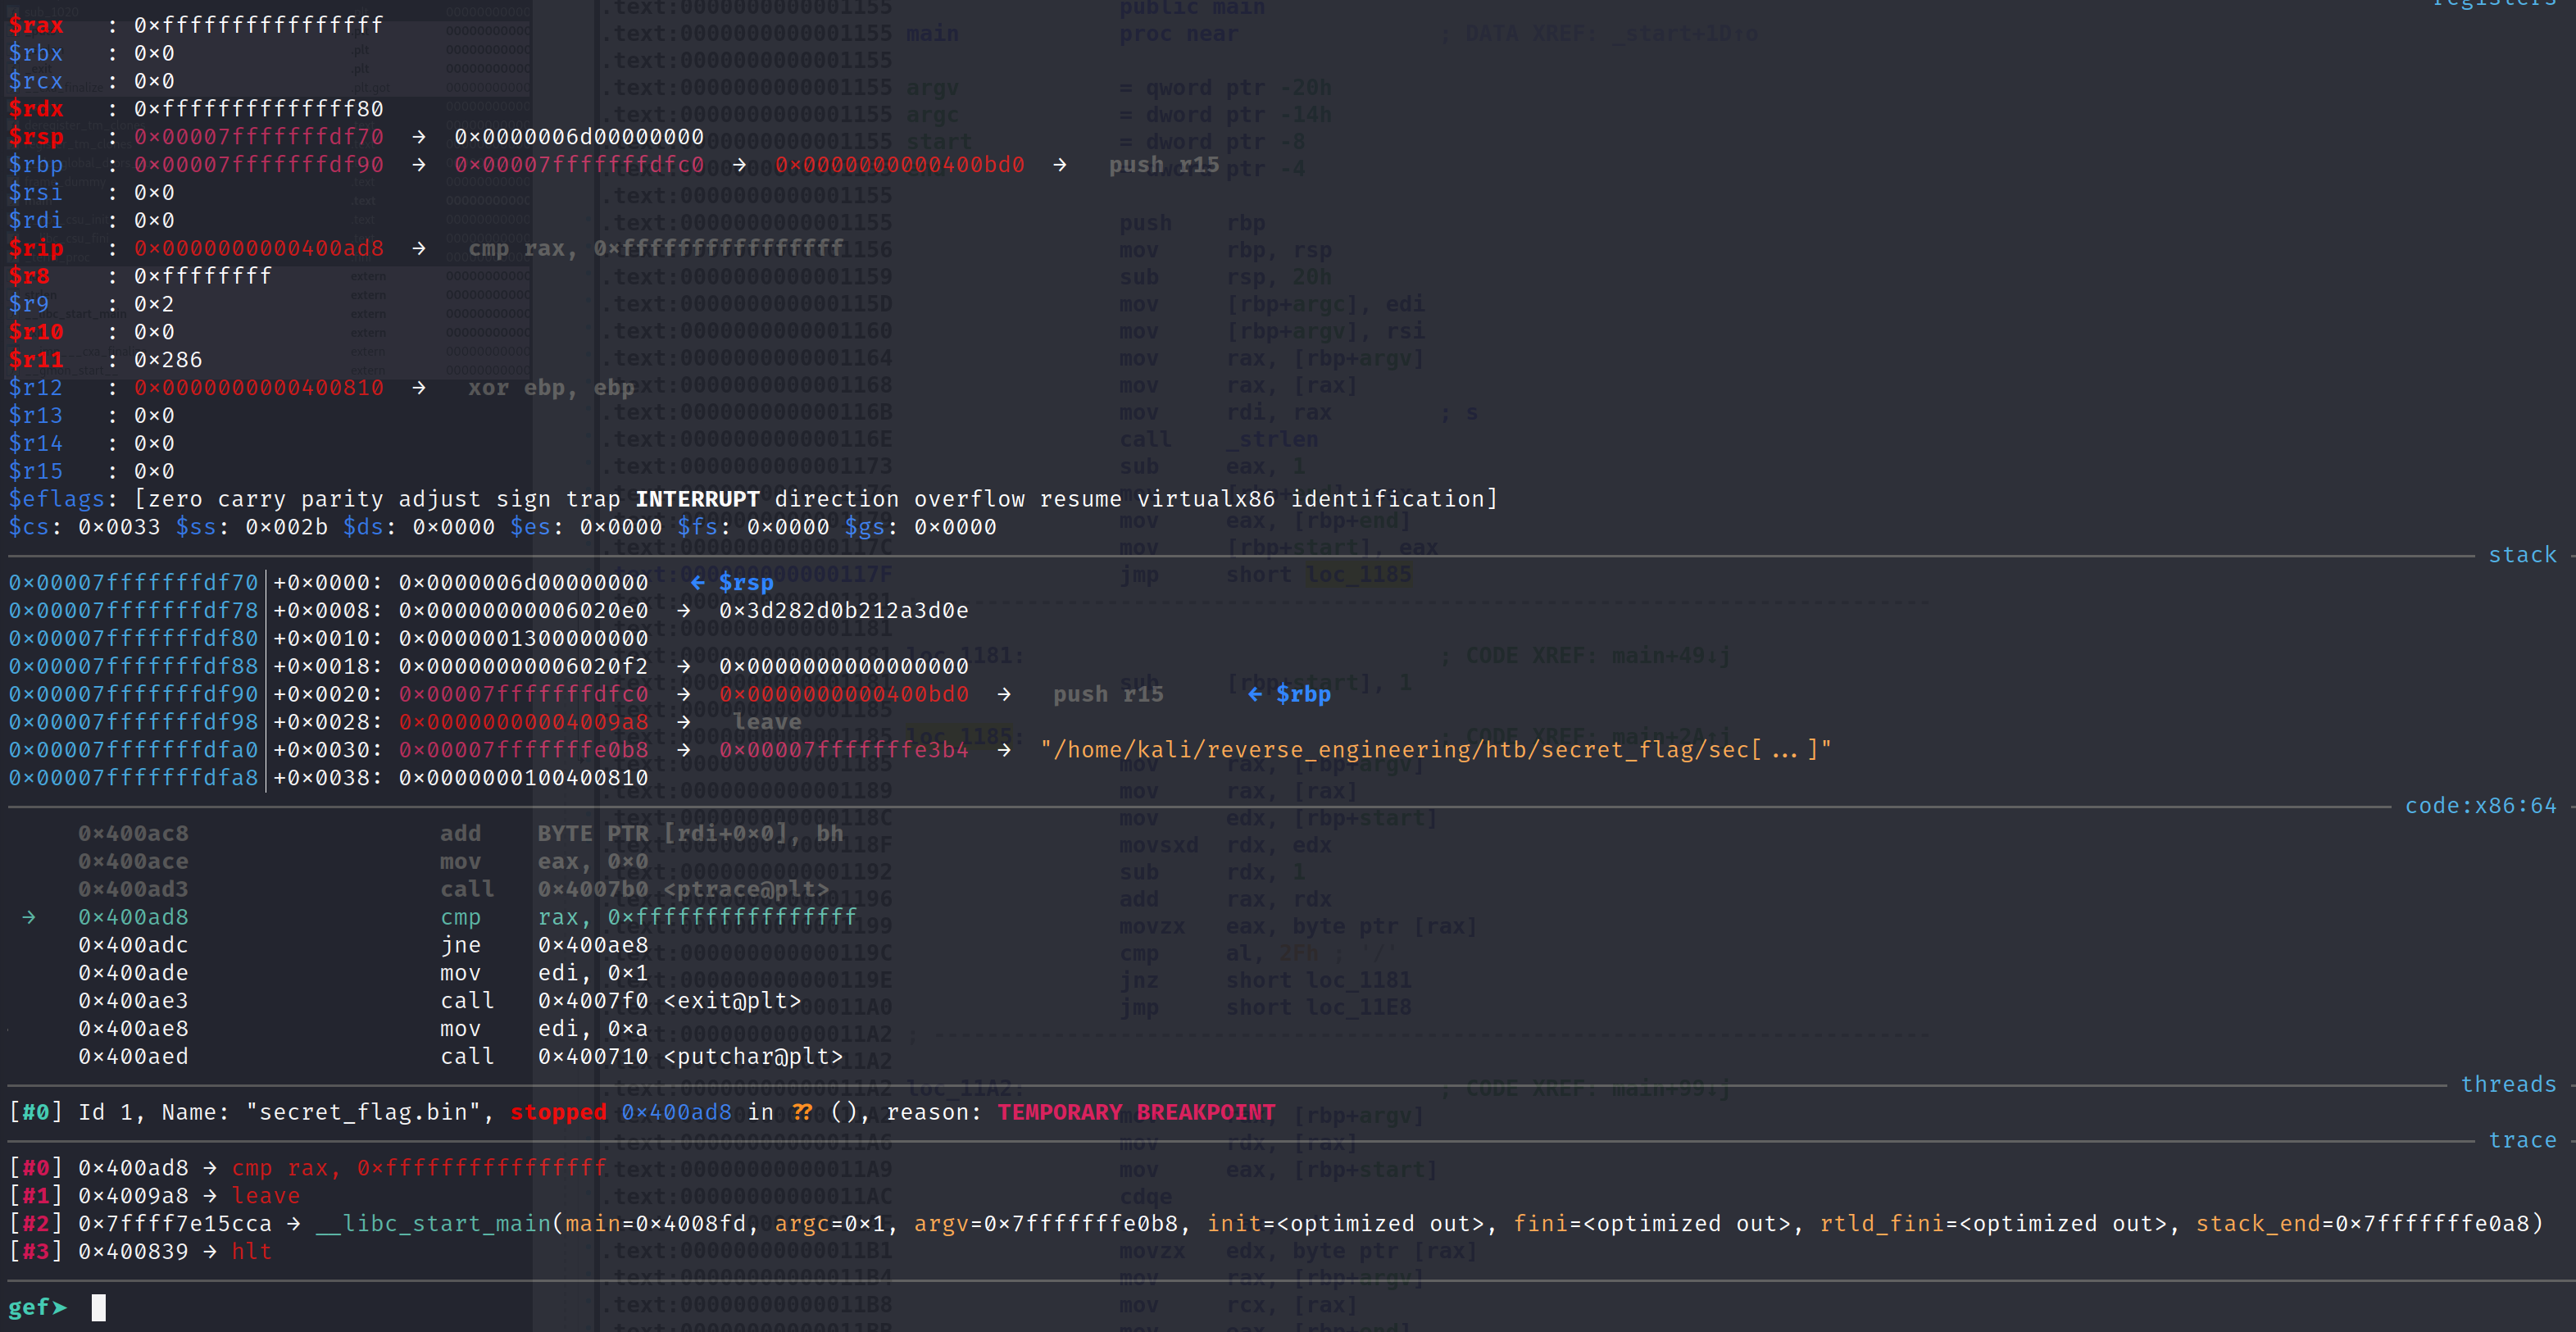
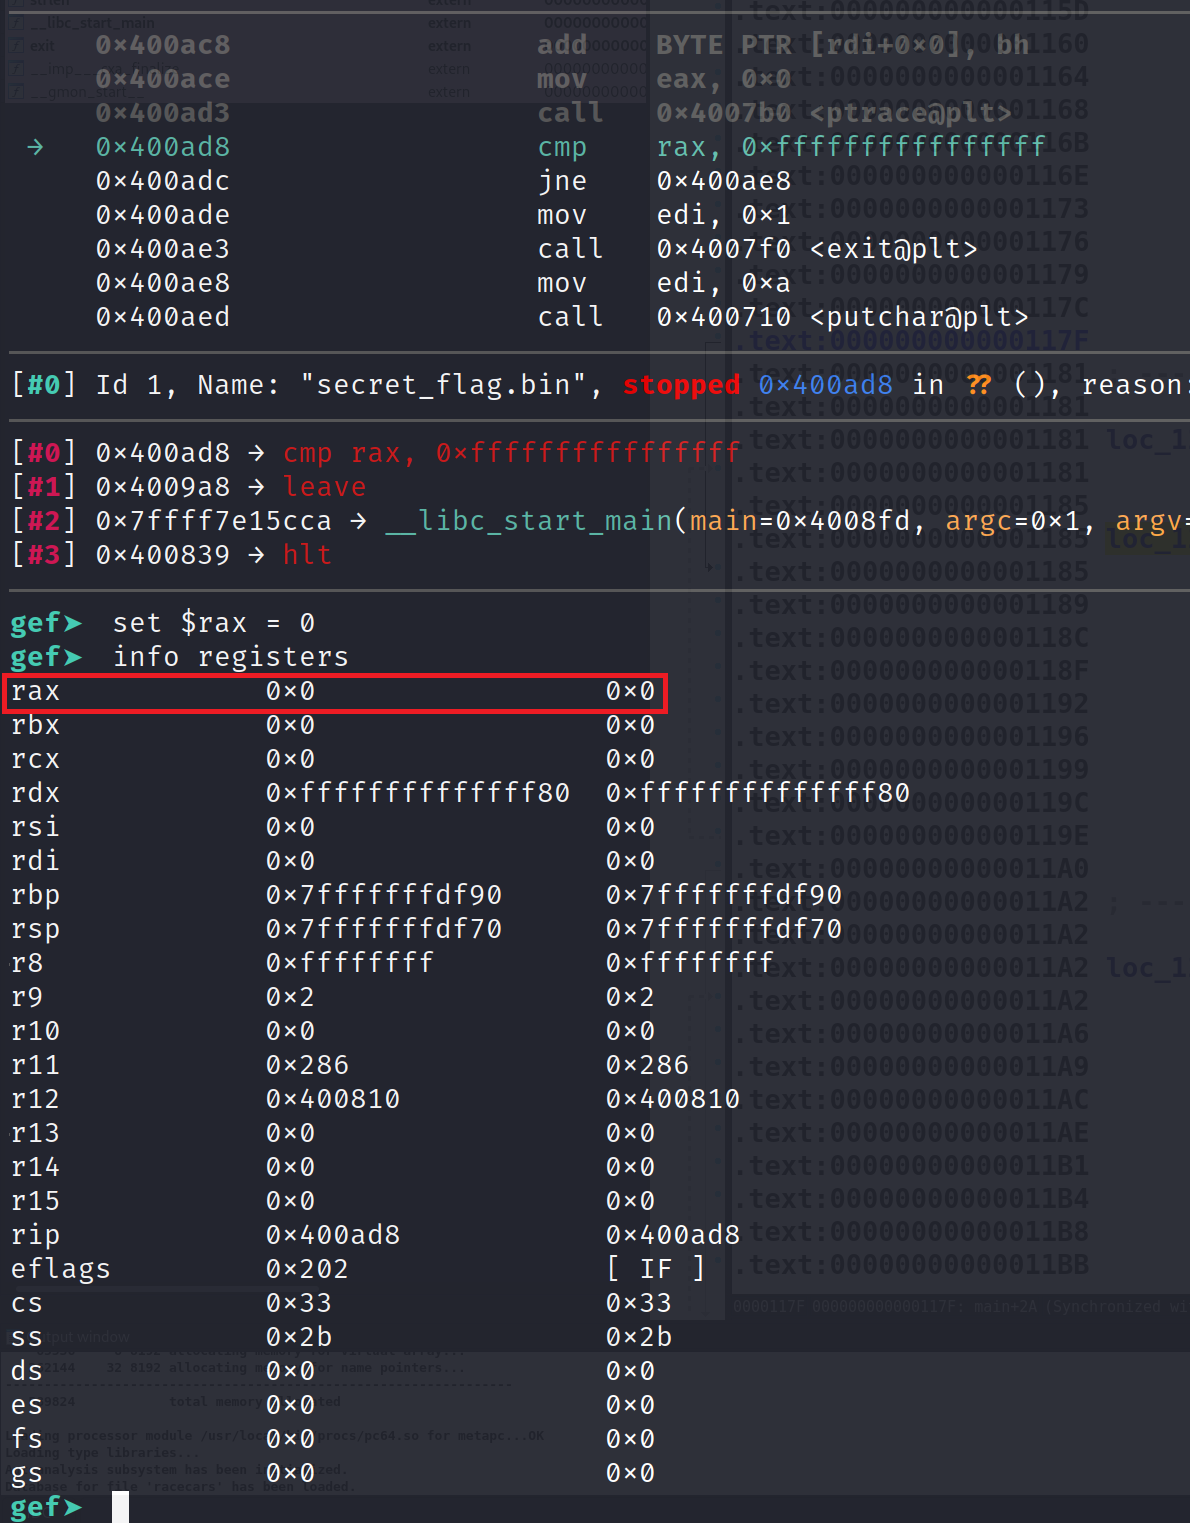
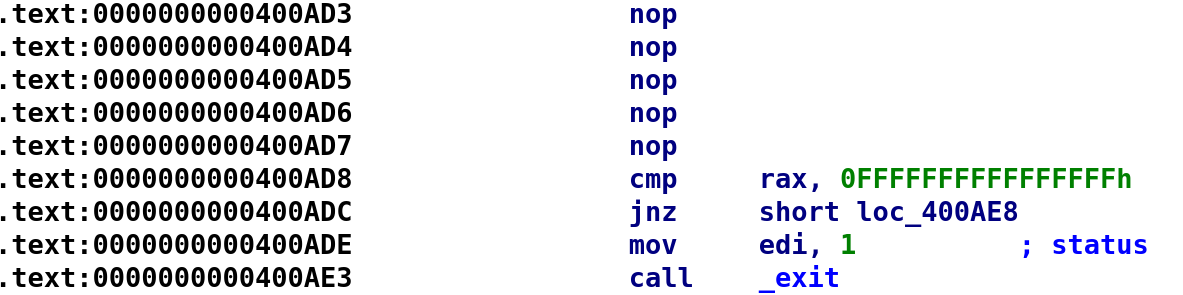
After ptrace finishes, it returns with a value of -1 (0xffffffffffffffff in hexadecimal). The very next instruction compares the return value (RAX) to -1. If they are equal you see that the program exits with a code of 1.
We also see some random output which is what we saw during normal program execution but we don't see the "Are you sure it's the right one." Alright so how can we bypass this so we can debug this? Well, it's quite simple! We are in a debugger and we can set the registers as we see fit! So, after ptrace gets called we can set the RAX register to 0. That way when it gets compared to -1, we'll be able to perform the jump to 0x400AE8.
Restart the program and allow the ptrace function to run. After it finishes set RAX to 0. I'll demonstrate below. You can verify the change by running info registers.
Now, we can continue debugging the program. Perform two step instruction, si, and you'll notice that we jump to address 0x400AE8.
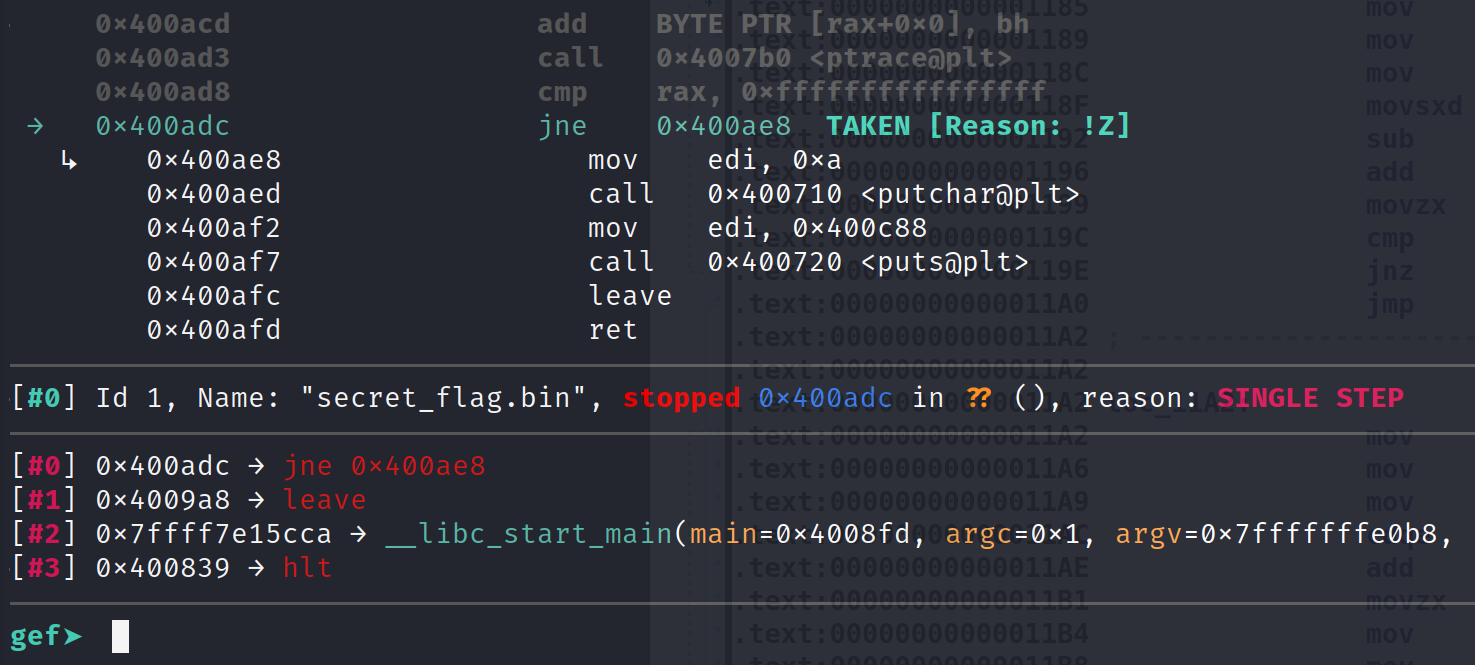
Notice this time we are going to jump to the address because RAX is not equal to -1. Performing another step instruction will land us firmly at the address we wanted to reach.
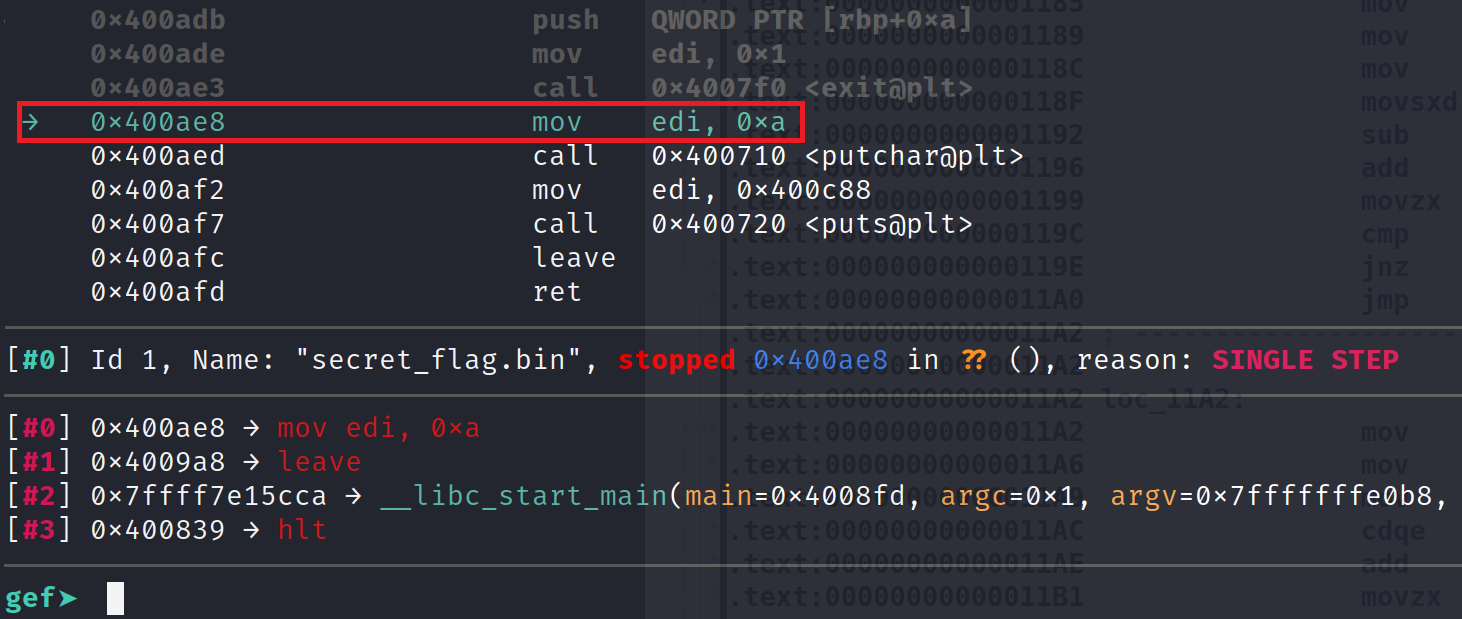
There you go! We have bypassed this simple anti-debugging technique! Another option is to change the call to ptrace to NOPs. This is probably a better option since you don't have to manually set registers. Let's try it out!
Nopping out the ptrace Function Call
Let's start by opening the binary up in IDA and navigating to a place where ptrace is called. For this binary that's here:
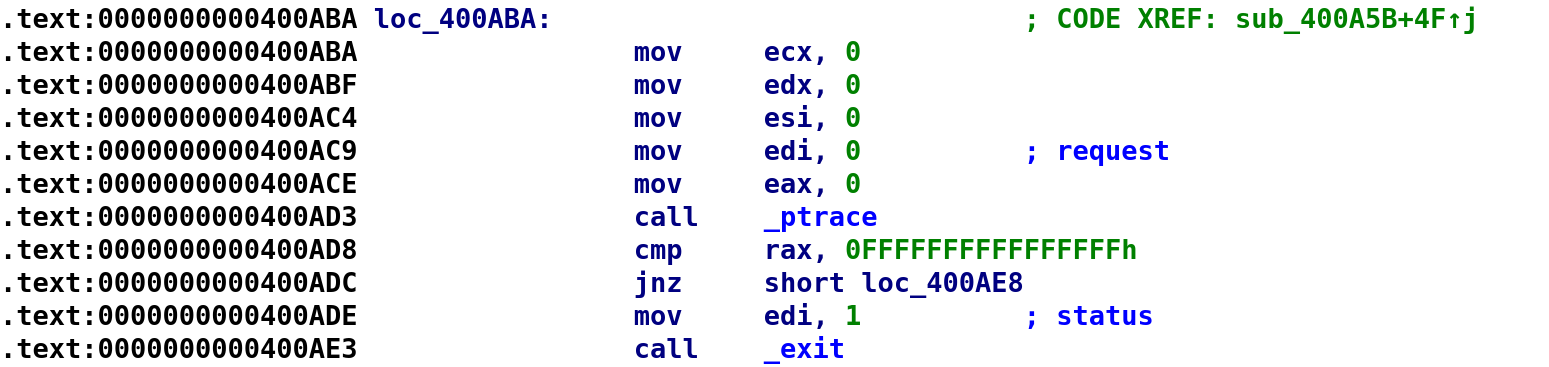
So, just like we did in the blog, let's find out what bytes are responsible for calling ptrace. Highlight the call _ptrace and switch to the Hex View.
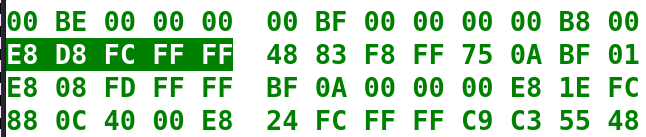
Now, let's open the binary up in a hex editor, find the bytes and change them to NOPs (\x90).
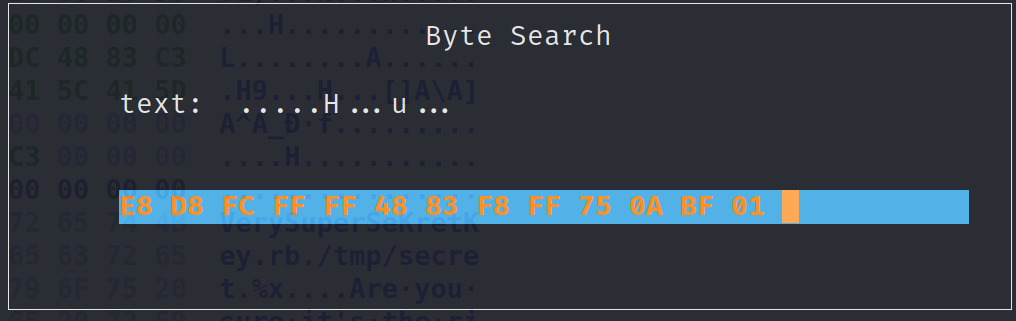
The bytes we want to modify are highlighted below.
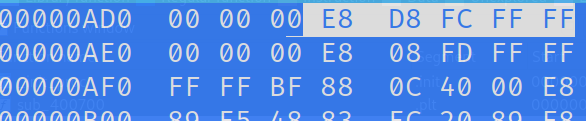
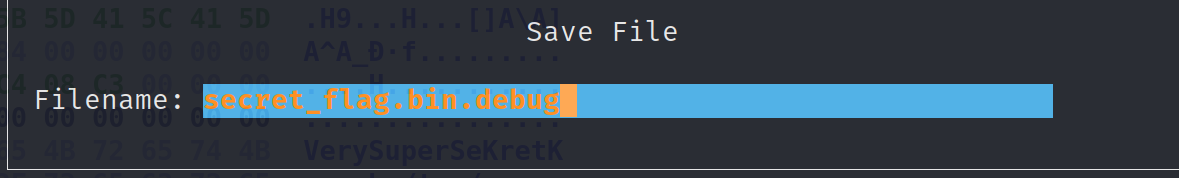
Now, change all of the highlighted bytes to 90 and save it as secret_flag.bin.debug.
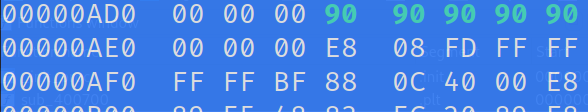
To confirm these changes, let's open up our modified binary in IDA. If we were successful, the call ptrace would be changed to 5 NOPs.
Now, let's try and debug this again. We should see that we have no problems debugging! Let's set a breakpoint just before ptrace was originally called, 0x400ACE.
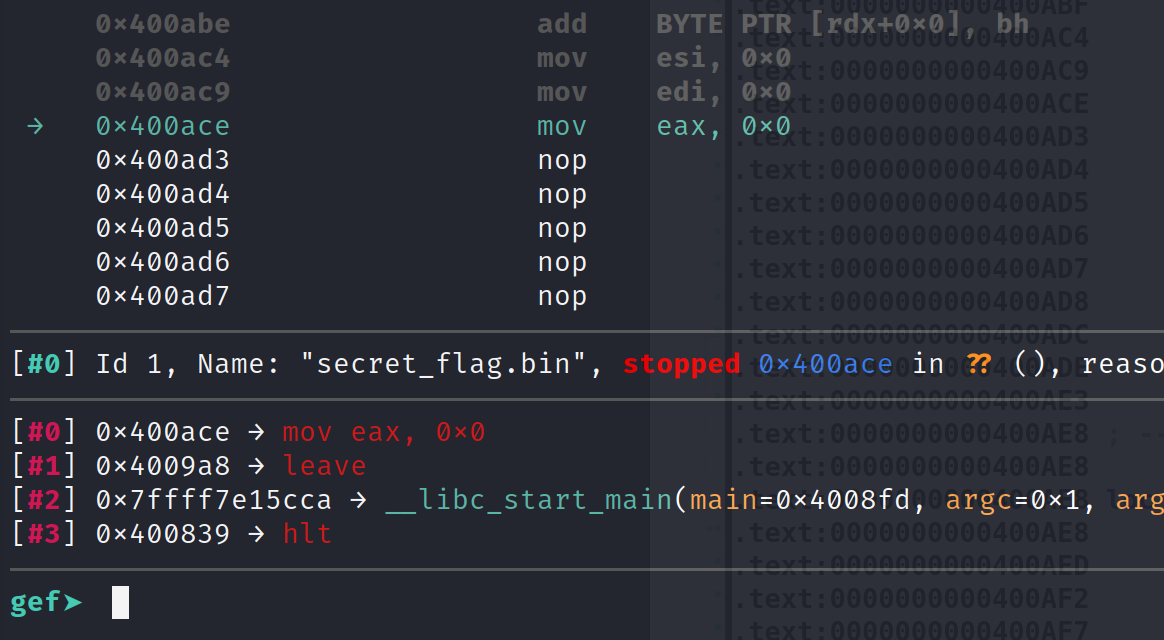
We can step through these instructions just fine and we will be able to continue debugging the program! Now, I know what you might be thinking. This is just one function call. If you recall, ptrace was called a few times. Wouldn't it be easier to just NOP out ptrace entirely? Unfortunately, it's not that simple. The ptrace function is inserted into the binary at runtime with the help of dynamic linking. So, we cannot simply NOP out the entire function globally. We have to do it on a case by case basis.
Conclusion
That's all I have for this post! I hope you enjoyed reading and that you learned something new! If you have any questions feel free to hit me up on Twitter, Instagram, or Discord: jaybailey216#6540. If there is a challenge you want me to try or a tutorial you would like, feel free to shoot me suggestions! I'll see you all next time!
Peace out! ✌🏾